Reverse Osmosis Plant Performance Calculator
About Calculator & How To Use
@ The performance of an RO/NF system is influenced by the feedwater composition, feed pressure, temperature and recovery. For example, a feed temperature drop of 4°C (7°F) will cause a permeate flow decrease of about 10%. This, however, is a normal phenomenon
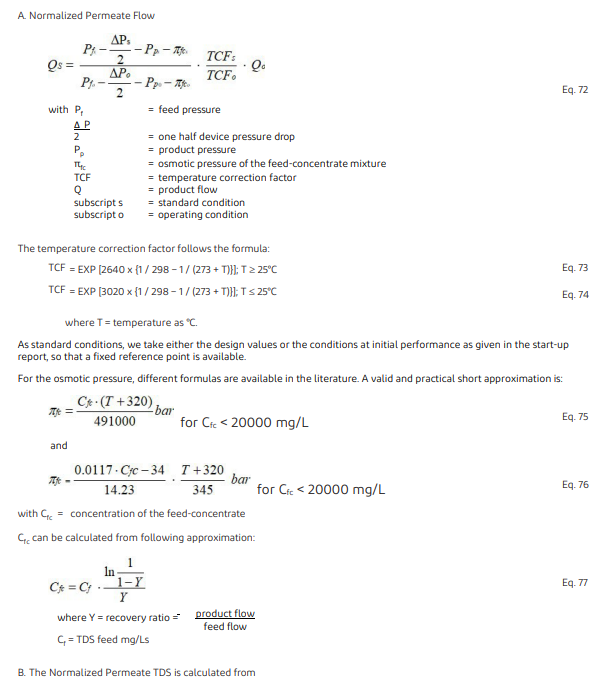
@ In order to distinguish between such normal phenomena and performance changes due to fouling or problems, the measured permeate flow and salt passage have to be normalized. Normalization is a comparison of the actual performance to a given reference performance while the influences of operating parameters are taken into account. The reference performance may be the designed performance or the measured initial performance
@ Normalization with reference to the designed (or warranted) system performance is useful to verify that the plant gives the specified (or warranted) performance. Normalization with reference to the initial system performance is useful to show up any performance changes between day one and the actual date
@ Plant performance normalization is strongly recommended, because it allows an early identification of potential problems (e.g., scaling or fouling) when the normalized data are recorded daily. Corrective measures are much more effective when taken early.
@ A computer program called FTNORM is available for normalizing operating data and graphing normalized permeate flow and salt passage as well as pressure drop. This program is available from our web site https://www.dupont.com/water and requires Excel software. Alternatively, the measured plant performance at operating conditions can be transferred to standard (reference) conditions by the following calculations
-
How to use: Enter Water Analysis & Parameters or Use the Default - Hit UpdateChart and Calculate
-
The summary was shown below.
Input Values
Feed Water Analysis - Values Of Start Up - Mg/L
| Ca | |
|---|---|
| HCO3 | |
| Mg | |
| SO4 | |
| Na | |
| Cl |
Feed Water Analysis - Values After 3 Months - Mg/L
| Ca | |
|---|---|
| HCO3 | |
| Mg | |
| SO4 | |
| Na | |
| Cl |
Parameters - Values Of Start Up
| Temp 0c | |
|---|---|
| Pressure psi | |
| Flow gpm | |
| Recovery % | |
| Pres, drop psi | |
| Permeat Pres, psi | |
| Permeat TDS |
Parameters - Values After 3 Months
| Temp 0c | |
|---|---|
| Pressure psi | |
| Flow gpm | |
| Recovery % | |
| Pres, drop psi | |
| Permeat Pres, psi | |
| Permeat TDS |
Result
For the standard conditions we have:
Chart

System & Operating Permeat Flow & TDS
System Flow: GPM
Operating Flow: GPM
System TDS: MG/L
Operating TDS: MG/L
Summary

@ Compared to the start-up conditions, the plant has lost % capacity. This is a normal value after a period of 3 months.
@ Compared to the initial 83 mg/L, salt rejection has slightly improved. Such behavior is typical for the initial phase
@ Note: The temperature less than 25oC


